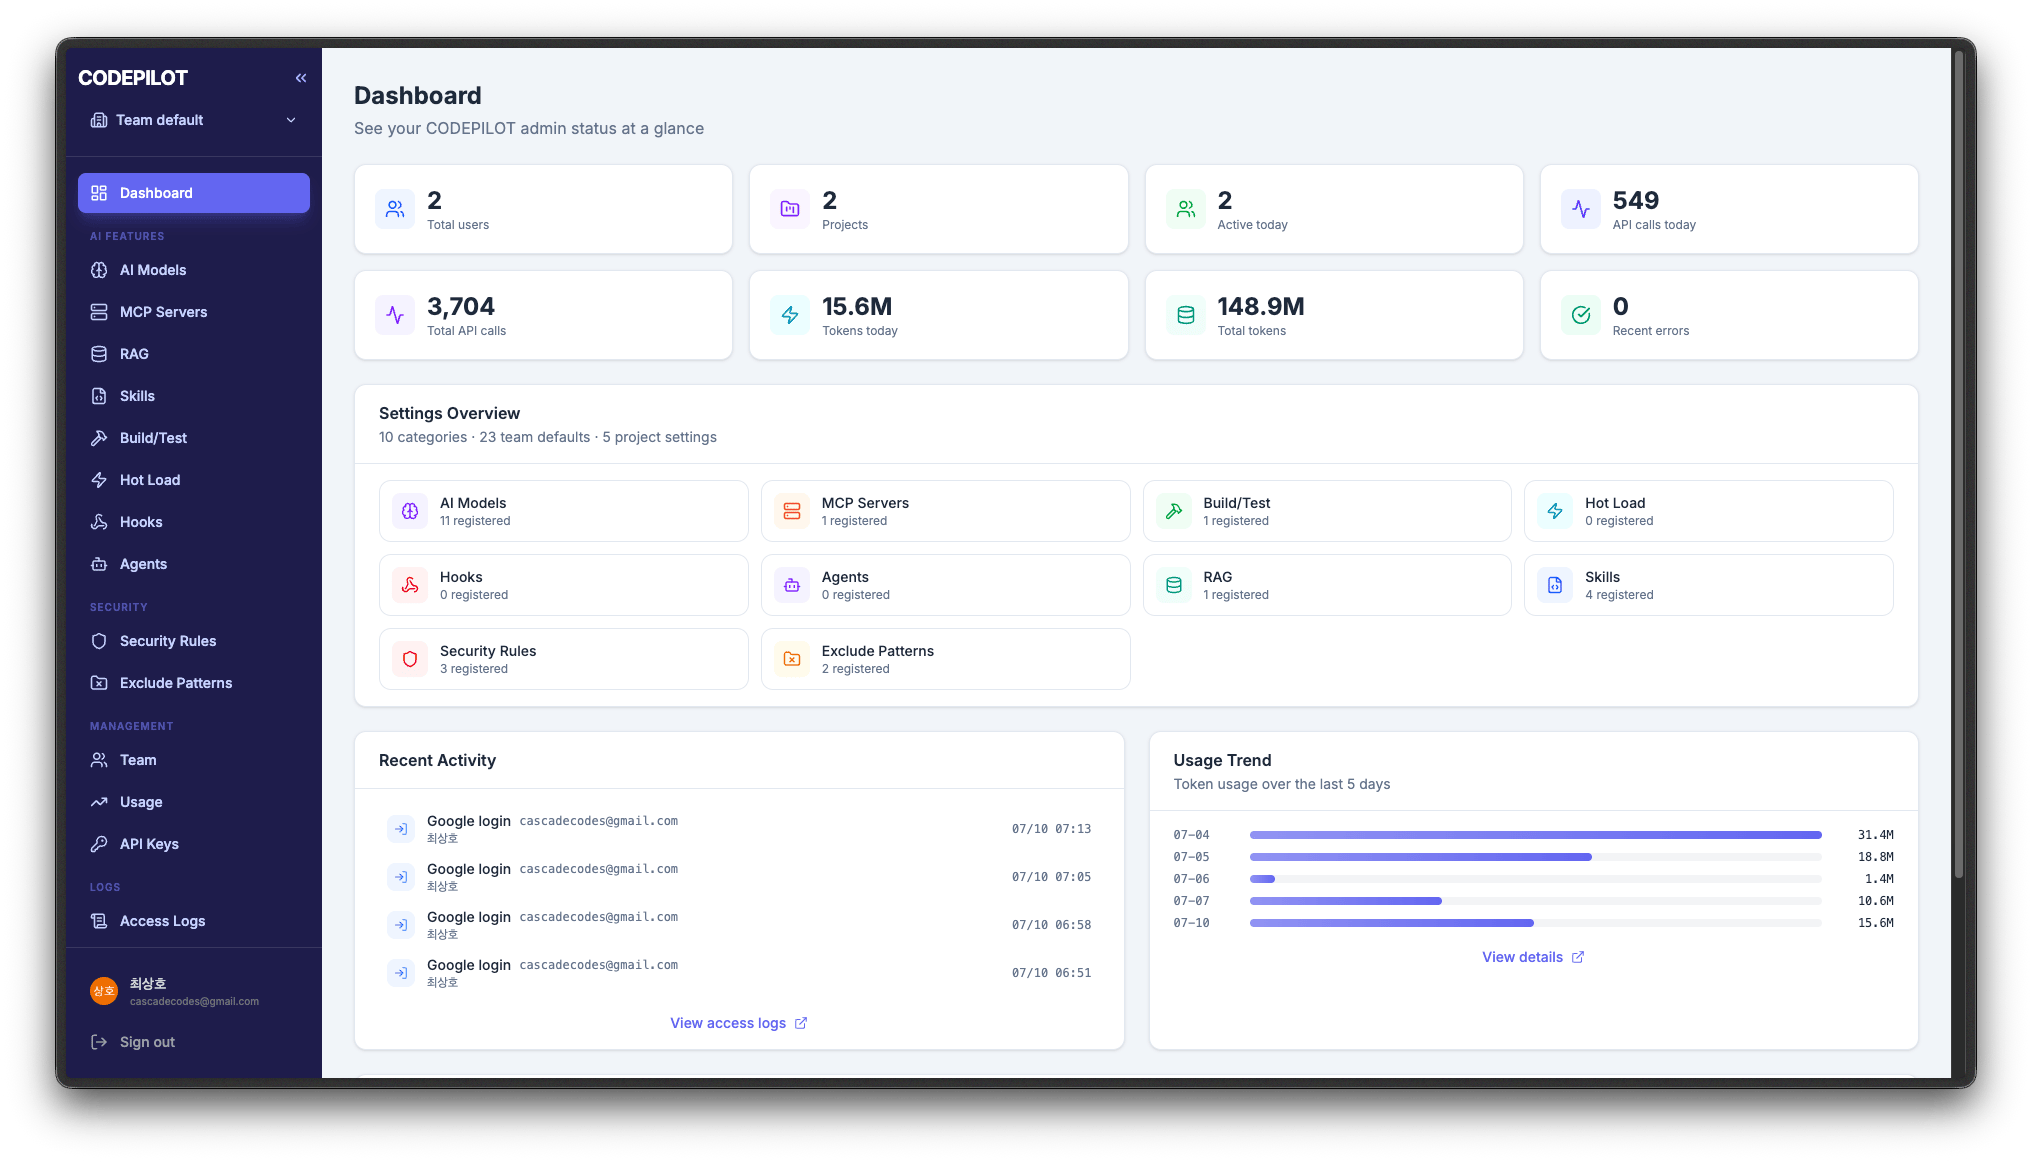
Track token usage and request activity to forecast costs.
Metric
Description
Total token usage
All tokens within the period
Average request size
Average tokens per request
Total requests
Number of AI calls
Active users
People who actually used it
In more detail, you can view daily usage, usage by user, and token breakdown by model.Choose the last 7, 30, or 90 days, or set a custom range, and use CSV export to download the data for internal cost accounting.
Forecast and optimize operating costs based on accurate data rather than vague guesswork. If a particular user’s consumption is excessive, you can set a token limit on the Team page.
Review the history of user logins and key administrative activity.Logged activities include login and logout, organization creation, member invitation/role change/removal, configuration add/edit/delete, document uploads, and API key issuance.Use search and filters to narrow results by a specific user or IP, success or failure, and time period, and export them to CSV.
For security audits and compliance, you can trace who changed which setting and when.